Working on something new
I have been learning about how to conduct feasibility analysis into prospective investments.
The “time value of money” refers to the idea that every cash flow, whether that be in or out, has an adjusted value based on where in time that cash flow occurs. For example, if you receive $100 today, you can (and should) treat that $100 as being worth more than $100 received in a year’s time. This is because that $100 could be working for you over that period of time, invested somewhere and earning a return.
This is a concept called Present Value, and it is a way of recognising the earning potential of money and opportunity cost. This is also more informally referred to as “discounting” of cash flows, and “today’s money”.
Once you have Present Value in your toolbox, you can work out some useful numbers relating to a particular investment or project:
- Net Present Value: The sum of all present values of the cash flows within an investment, or the total return in today’s money.
- Internal Rate of Return: An effective rate of return, which can be used to compare between competing investments.
Turns out that there is an entire discipline of financial management around this: it’s called Capital Budgeting. And it’s fascinating and useful.
I have done quite a bit of work doing feasibility calculations using the principles of NPV and IRR, particularly applied to real estate. One of the things that I realised very early on was that doing this sort of thing in Excel is very painful. There are a lot of reasons for this, a few of which are:
- Complex spreadsheets are error-prone, and very difficult to debug.
- The process of representing a large number of cash flows is very manual and labour-intensive.
- There is a lot of duplication of information, particularly when it comes to recurring cash flows.
So this is a problem that I have realised that I would really appreciate a well-designed piece of software to help me with. And in the spirit of “scratch your own itch”, I’ve decided to start working on it.
I have actually had a few cracks at this already over the years, but I have always gotten bogged down while “tinkering with tools”. If you are a technical person, you will probably know exactly what I am talking about, and how tempting it can be.
You can only sharpen your tools so much before it comes time to actually make something with them. This time I have decided to resist this, and race to running software using a tool that is very rapid and vanilla (Ruby on Rails).
I’ve also decided to blog about it as I go along, in order to crystallise my thoughts and maximise my learning.
I drew up a few wireframes around this concept almost three and a half years ago. Having another look at them, I find them to be still quite valid and representative of the concept.
The application would be centred around the concept of “deals”. Each deal could represent any sort of discrete financial arrangment, e.g. buying an asset, taking out a loan, hiring an employee, etc.
The goal is to describe the deal using a set of future cash flows, which can then be used to calculate NPV and IRR. Once we have these figures, we have the ability to compare this deal against other deals in order to determine where our money would be best spent.
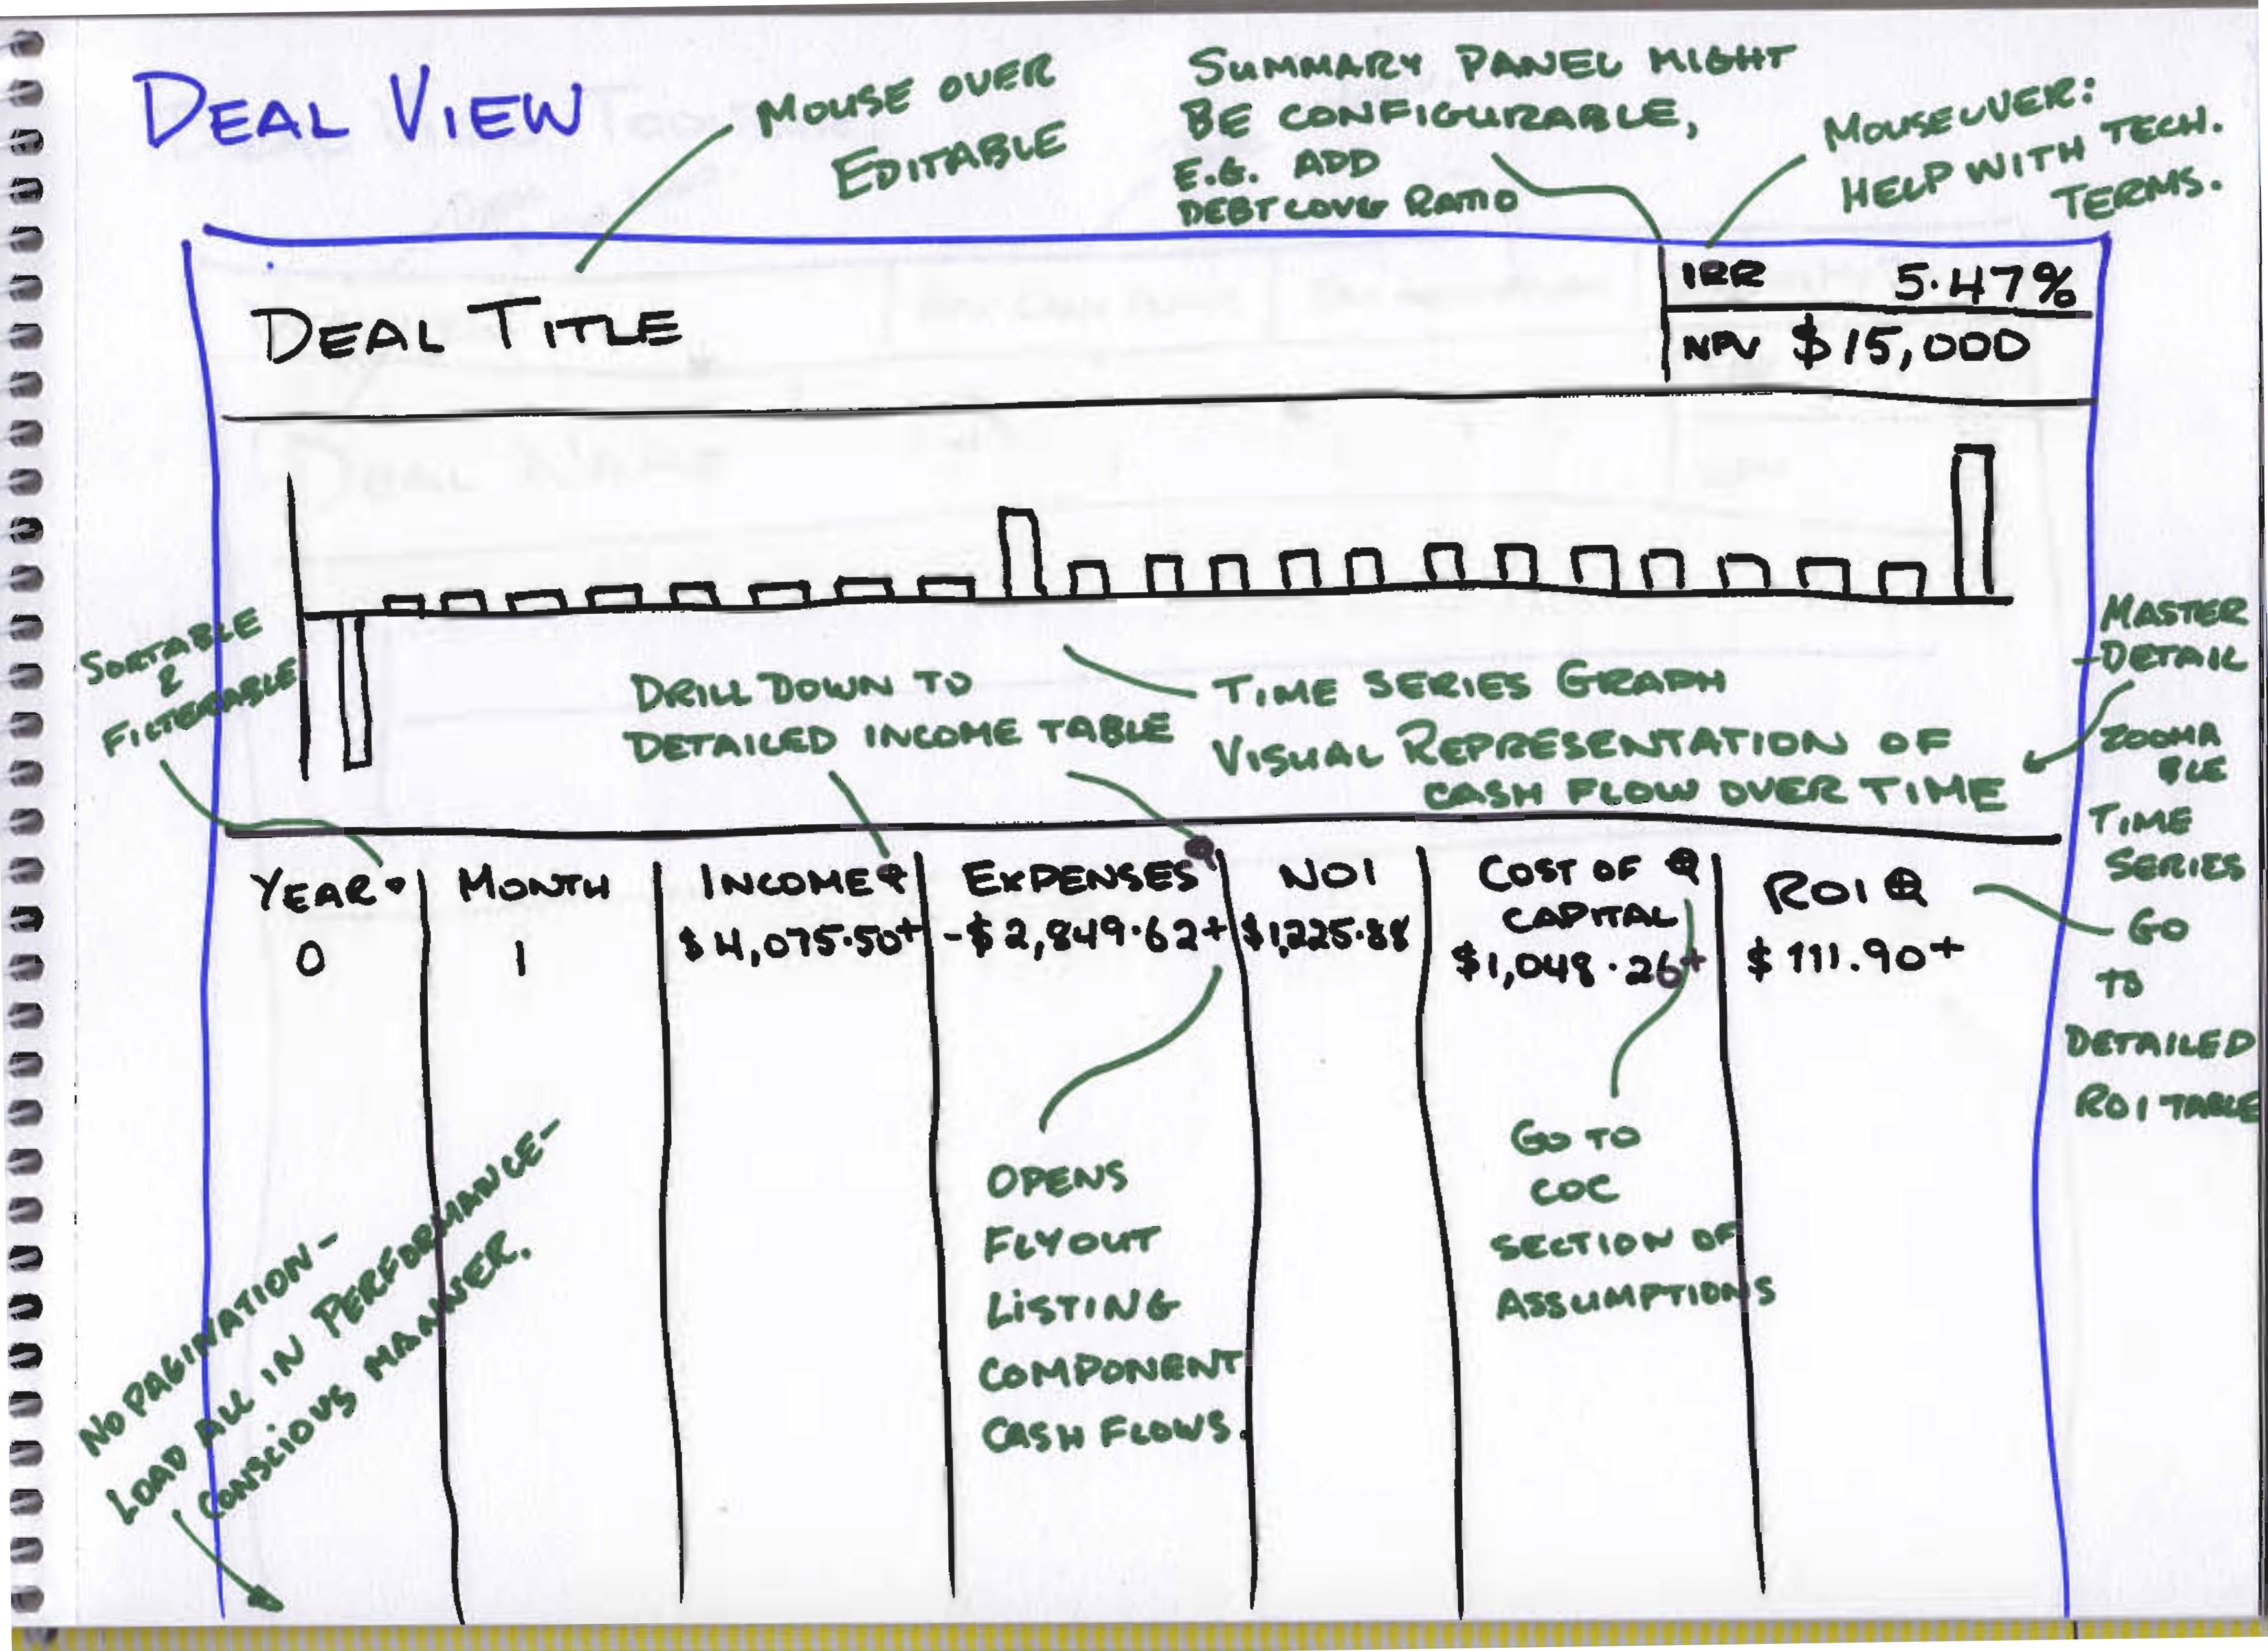
The “Deal View” shown in this wireframe is an overview of the deal, showing the future cash flows in both a table and a graphical histogram form.
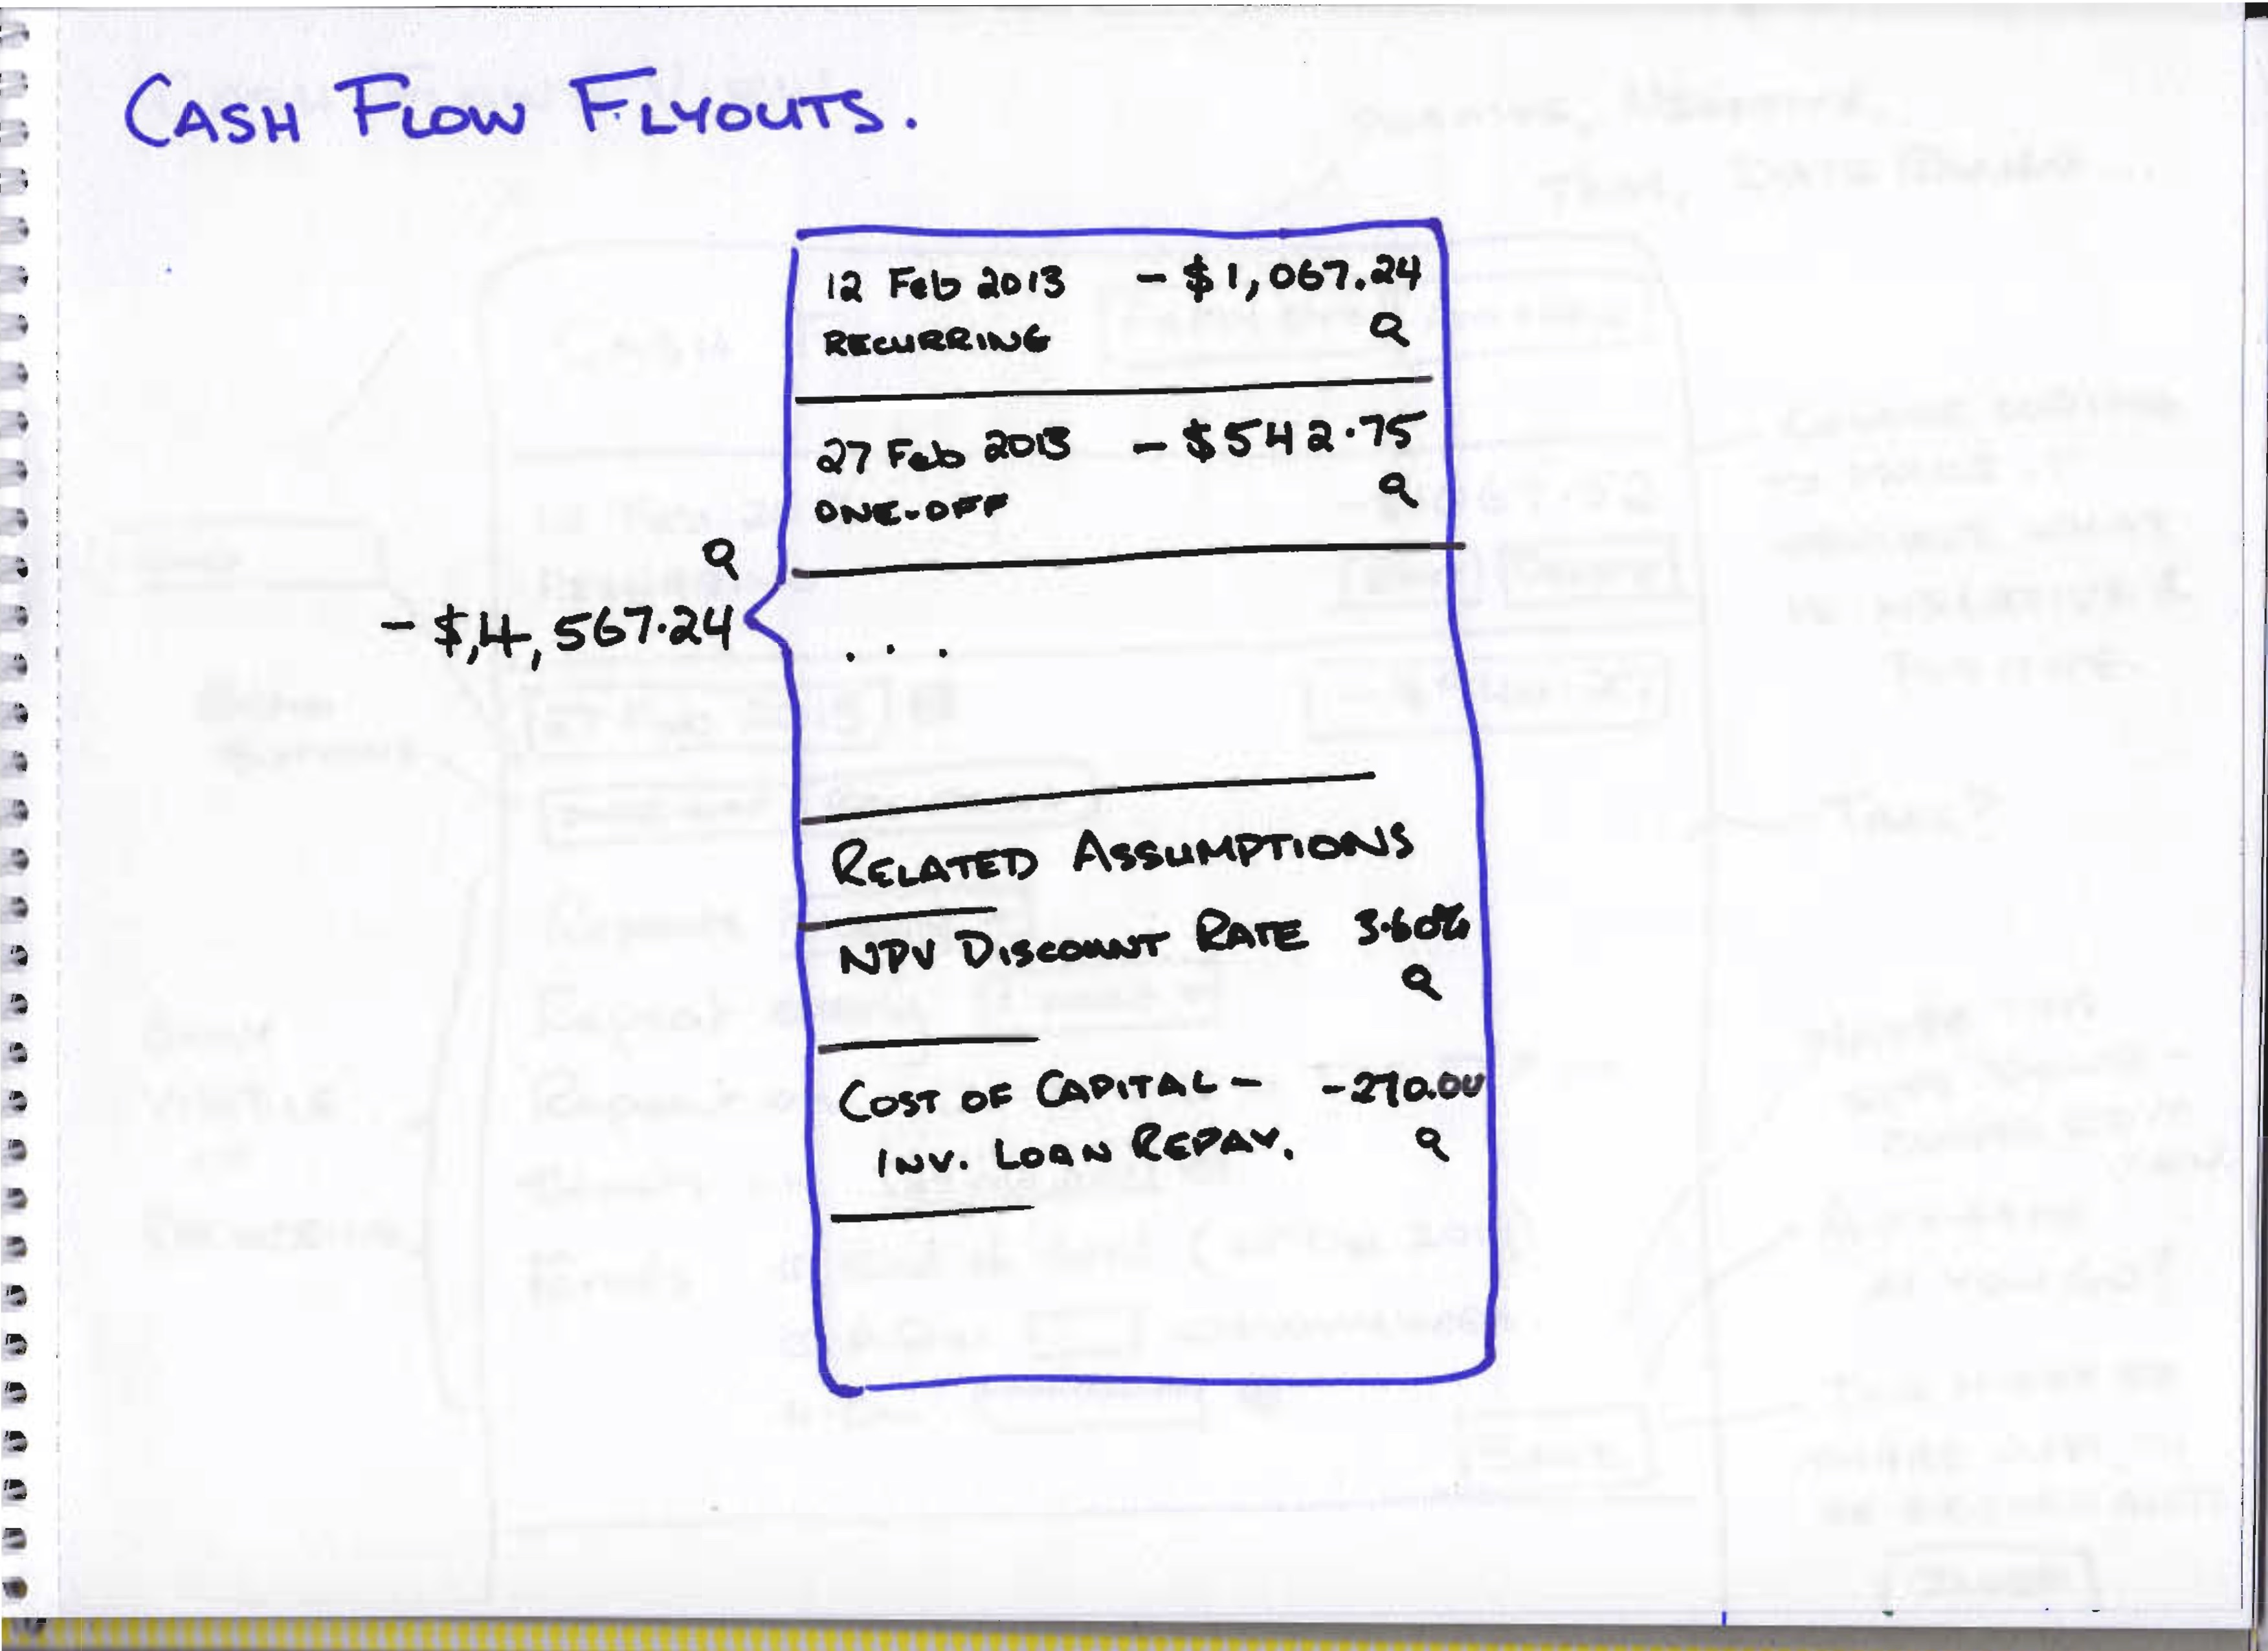
The table within this view would aggregate all of the cash flows in any given month into a single figure. Clicking or hovering over this figure would allow the user to drill down into the individual cash flows that make up this figure, as shown in the following wireframe.
You might have noticed that assumptions are mentioned in a few places on these screens. These are the variables that would power various aspects of the calculation. Examples of assumptions are the interest rate that we are able to borrow money at, or the discount rate that we are using for the present value calculation.
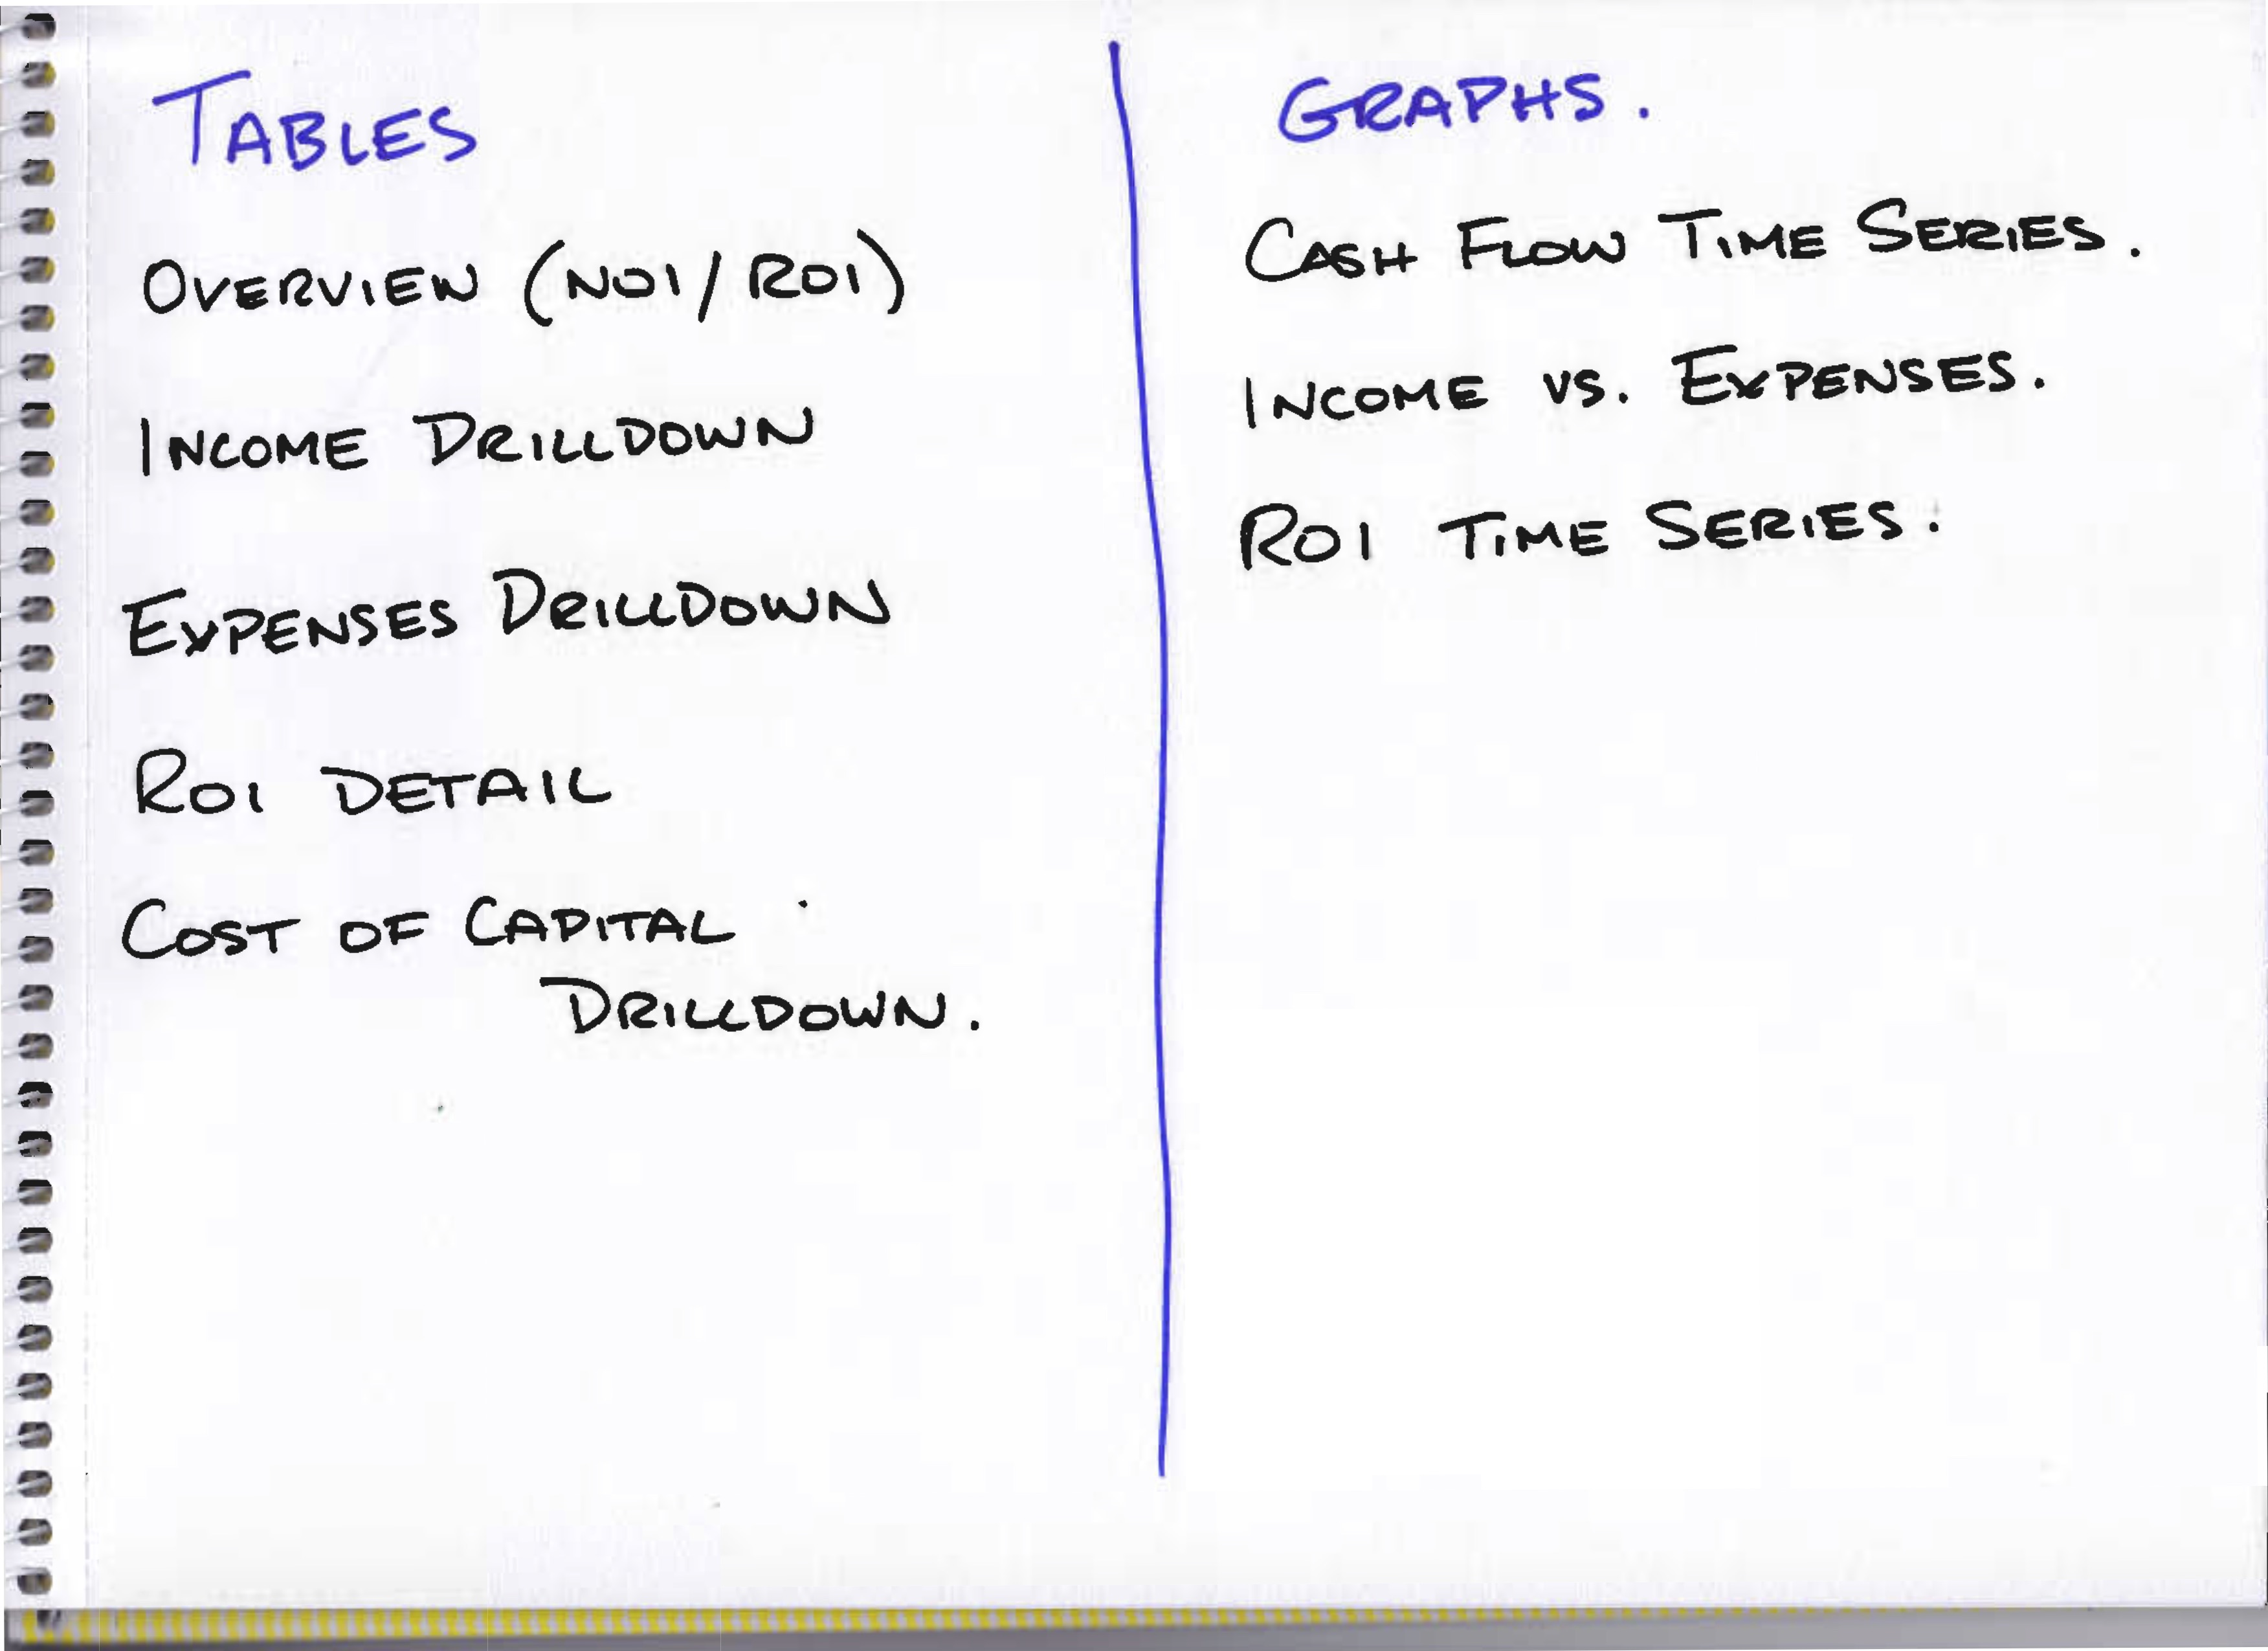
I also came up with a number of alternate tables and graphs that could be shown on the Deal View. The idea is that the user could toggle between these.
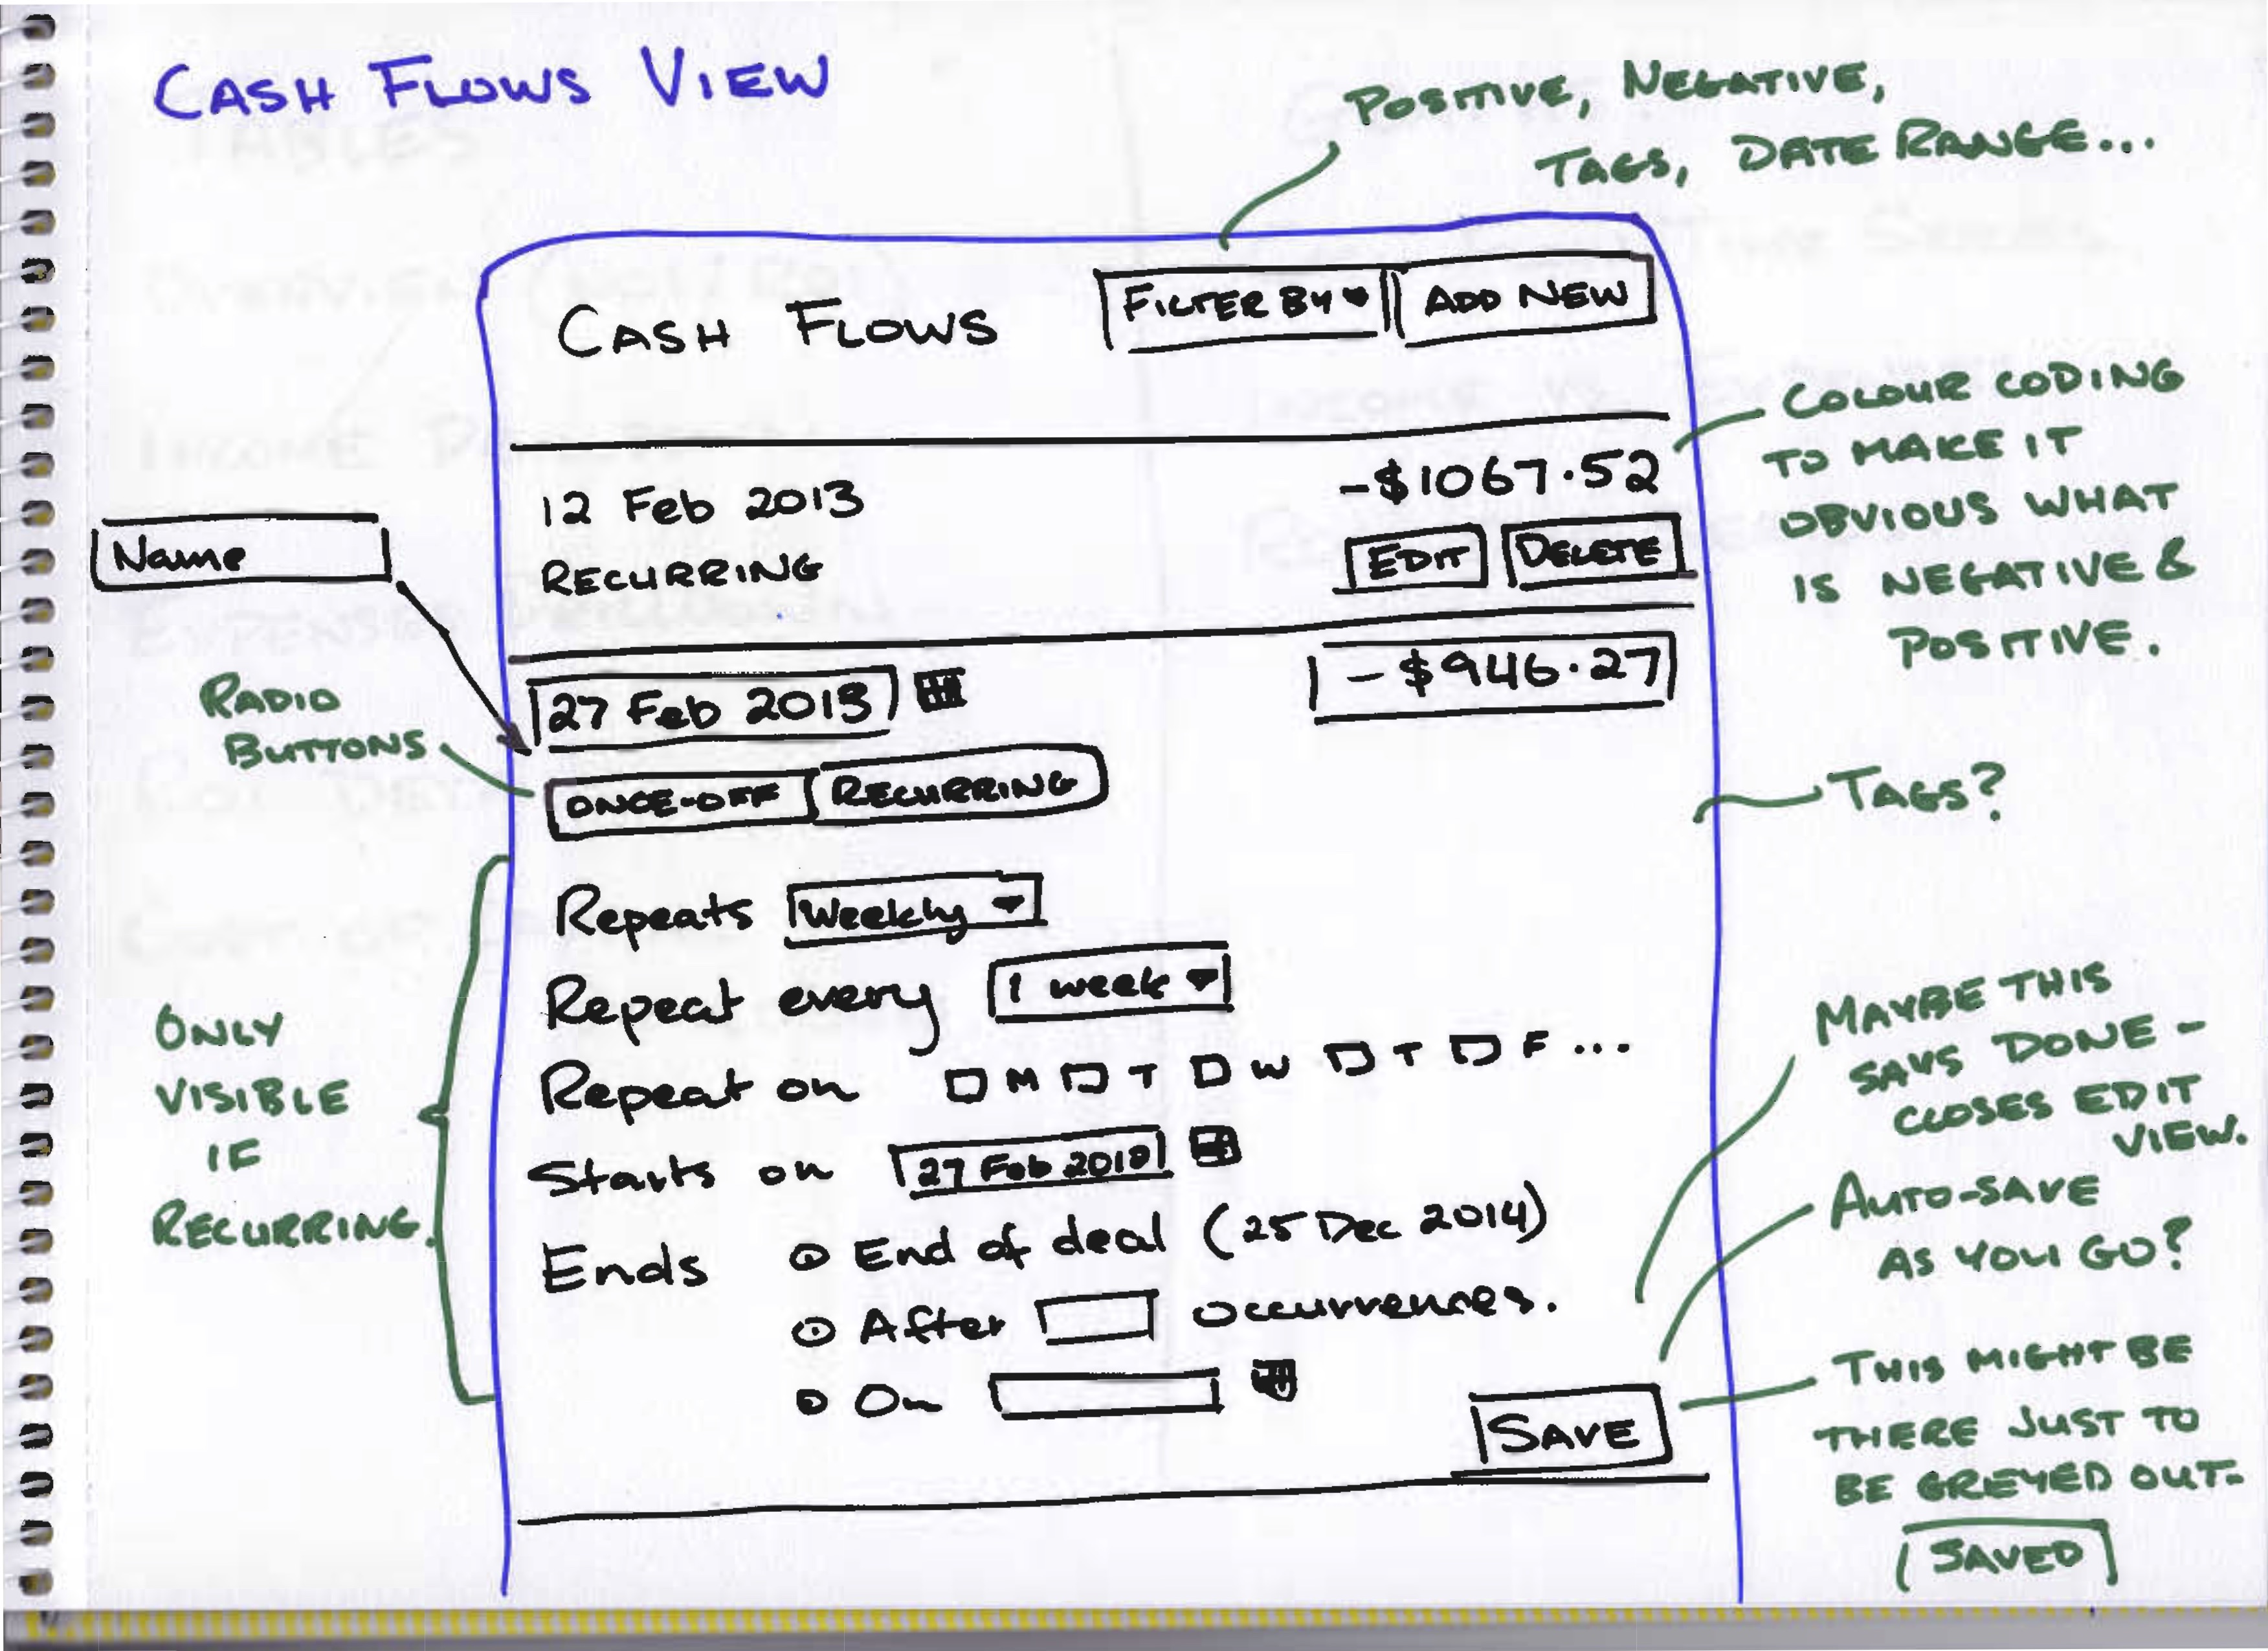
The Cash Flows View is where the user can edit the cash flows that make up a deal, and view the details at the individual cash flow level. There is provision to create recurring cash flows, and also to filter and search cash flows.
A quick map of the screens involved in my imaginary MVP might look like this:
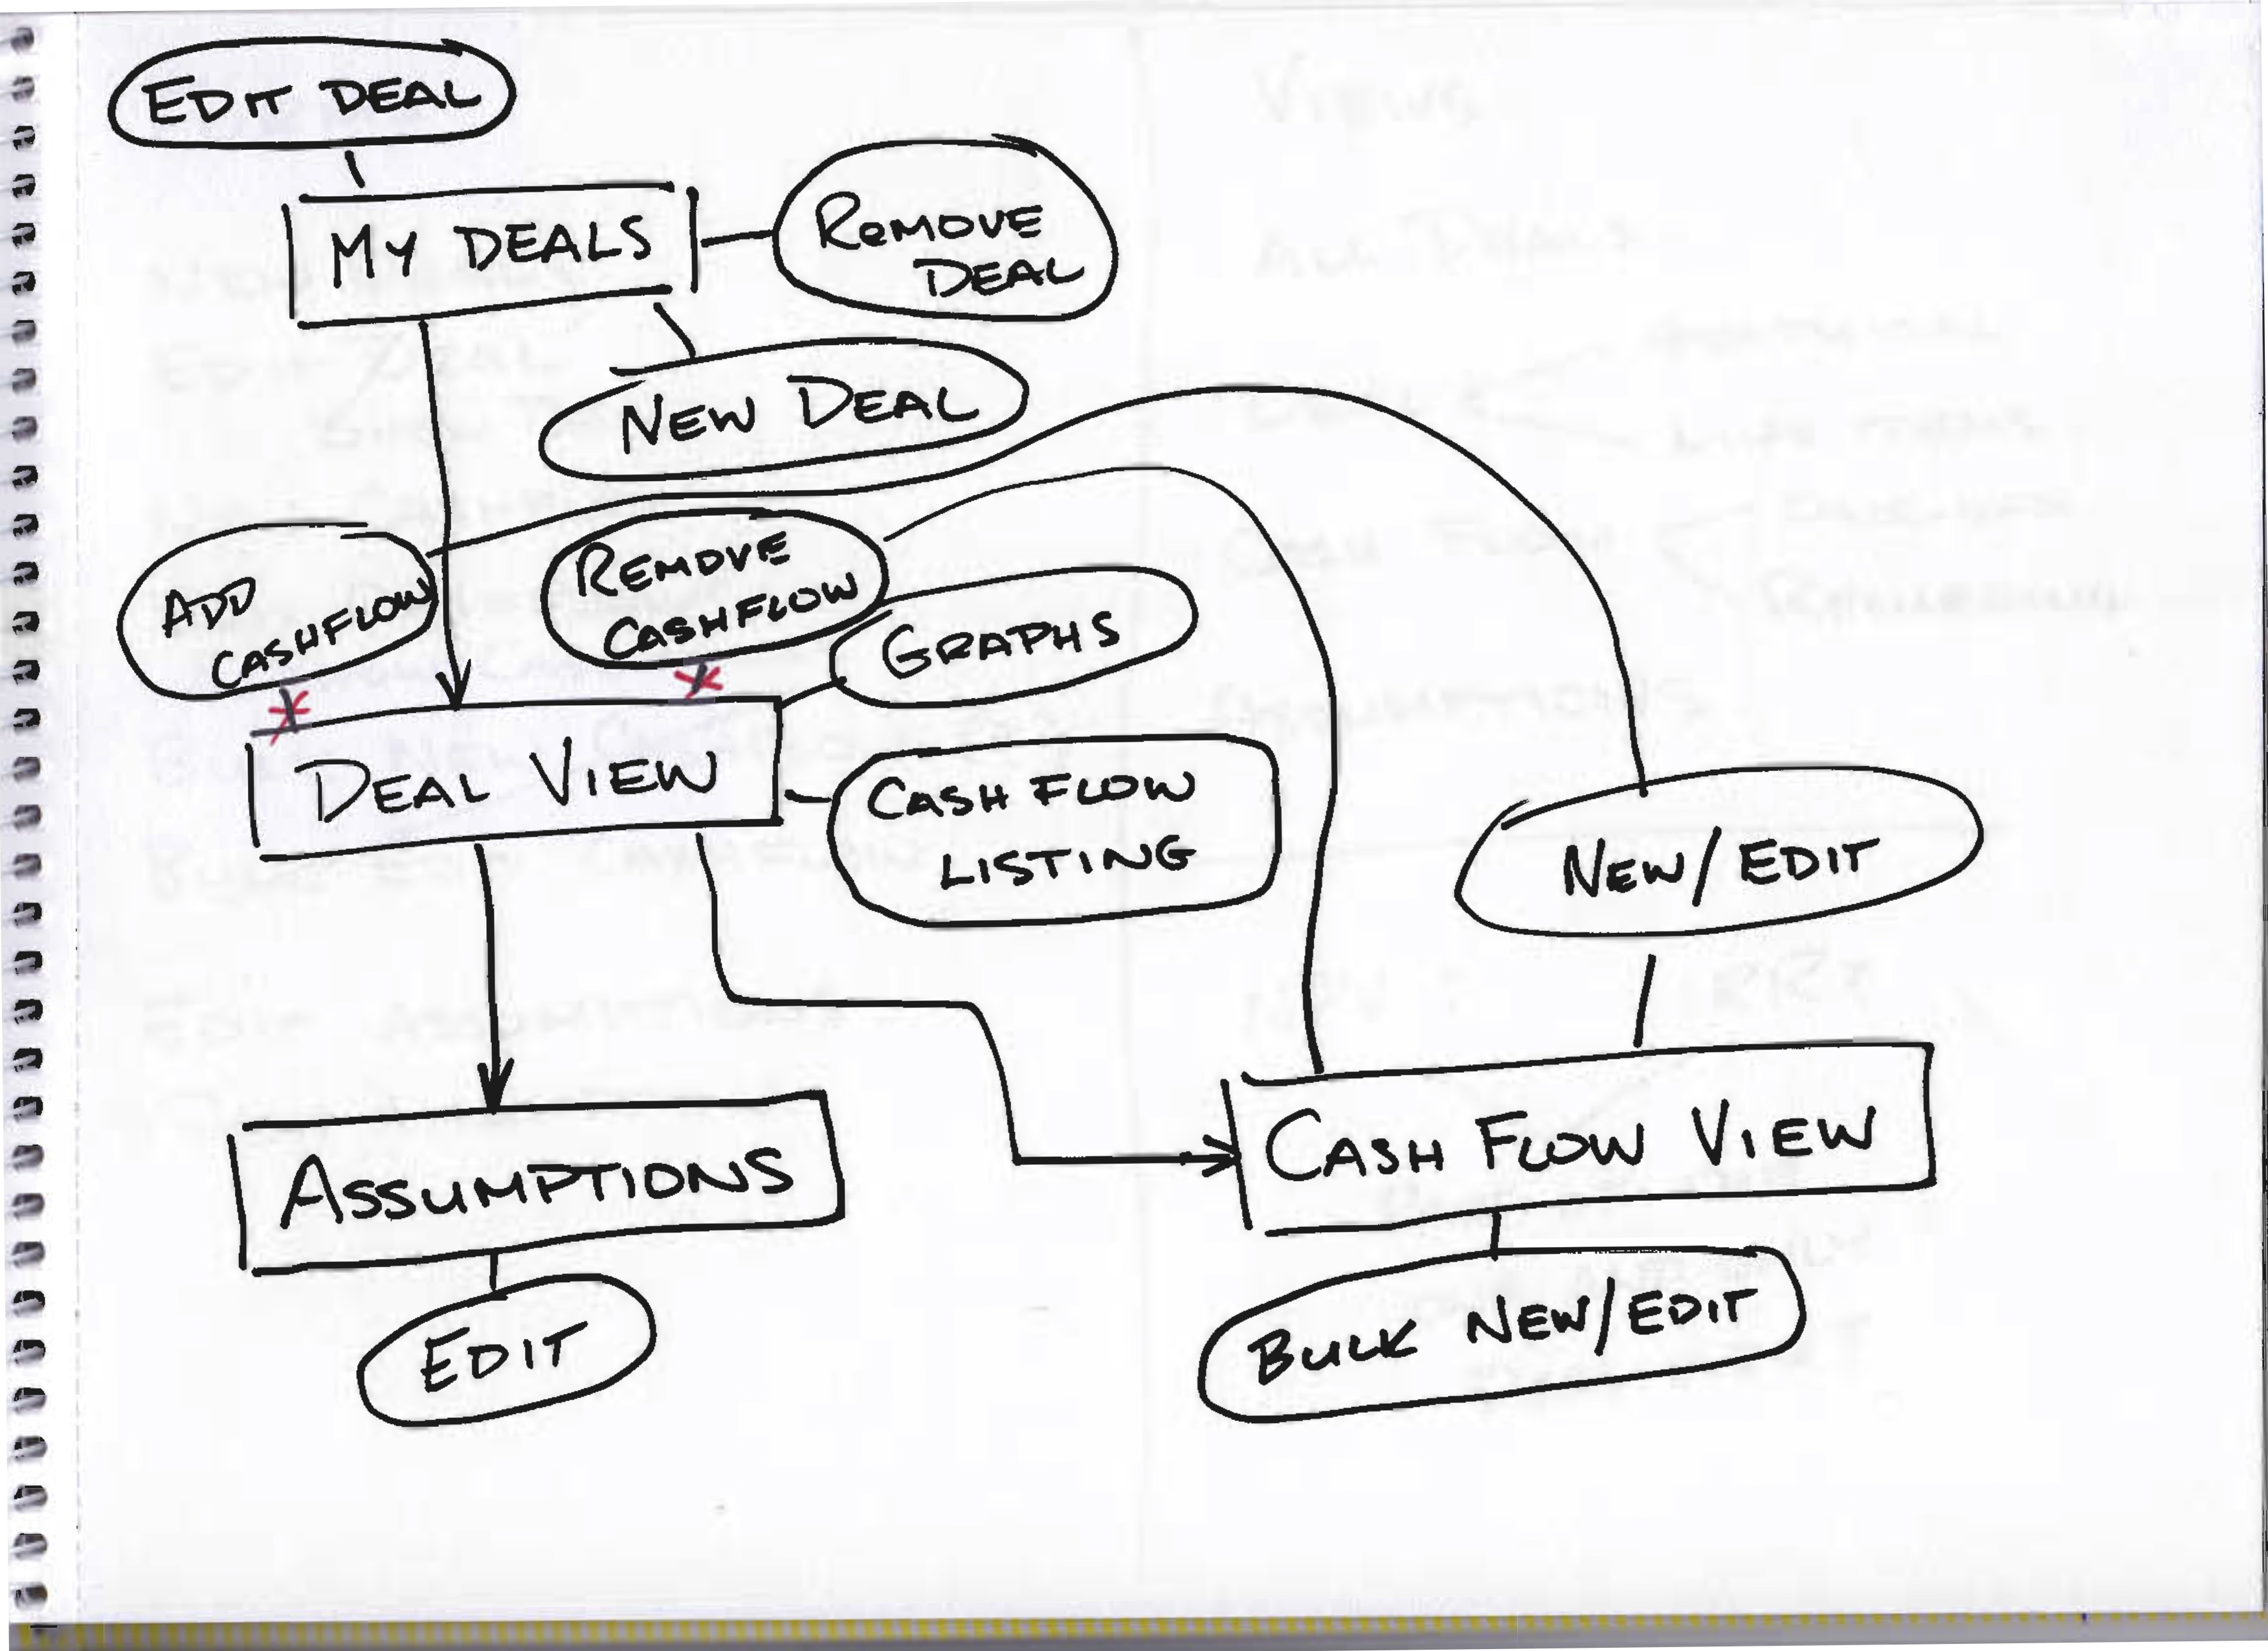
So I think that the next step is to get the first cut of the Cash Flows view up and running, so that I can input some data and experiment with querying it and performing come calculations.